The Complete Data Analysis Process for Digital Agencies
Everything you need to scale your agency’s services with a streamlined analytics workflow – plus four free data reporting templates.

Table of Contents
New clients hire you to get them results.
They also want to know how you are progressing towards those results.
That is where effective data tracking comes in.
What’s more?
Big-fish clients (the ones who drive long-term value and carry your agency to the next level) have come to expect their agency partners to be data-driven. Period.
Problem is – you probably don’t have a great process for this.
So every new client takes up a lot of your time, because you have to create new processes – spreadsheets, reports, visuals . . . from scratch.
So, the data becomes an afterthought in your business.
In this article, I’m going to give you my framework for a repeatable agency data analysis system that you can plug new clients into and run them through like clockwork.
A system that adds juice to every part of your agency's sales cycle, transforming flash-in-the-pan projects into long-term partnerships and advocates.
By the end you’ll have . . .
1. Plug-and-play templates to land more pitches with data-driven strategy.
2. A framework to help clients understand your value during service delivery.
3. A system to turn clients into advocates, close the loop, and win more business.
So if you are an agency that handles PPC, SEO or social media reporting and want these processes . . .
Then this article will be your bread and butter.
Once you have the system down . . .
You can run your new clients through it every single time. Get them the results they deserve and make your value crystal clear . . .
Just like Patch and his team at DCX …

And Josh with his team at Sculpt Agency …

Before we begin, shameless plug. If you want to hire us to build an advanced, streamlined, done-for-you data engine for your agency . . . check out our Analytics Automation Consulting Service.
As promised, you are going to learn how to plug your clients into a simple, value-generating system for agency data analysis in this article.
All right.
Let’s begin . . .
Why You Need to Let Data Drive Your Process
For the remainder of this guide, we’ll walk you through five steps to drive client acquisition and retention with data. Here are the items we’ll cover:
Step 1 – Dissect your client’s market and build trust with a data-driven, deep-dive audit.
Step 2 – Use the “Buyer Journey” Model to create a scalable, transparent, measurable strategy for your client.
Step 3 – Forecast the ROI of your strategy.
Step 4 – Turn one-off projects into long-term partnerships with ongoing data.
Step 5 – Tell the story of your results in authority-building case studies. Then use them to land new business and strengthen relationships with current clients.
First, Let’s Understand Your Agency Sales Cycle
As I mentioned, a repeatable, systematic methodology for high-quality data analysis will drive lifts in EVERY part of your agency’s sales cycle.
To help explain how, let’s first take a deeper look at the typical agency sales cycle.
A. LEAD GENERATION
During the lead gen stage, your job is to find key prospects who are likely to find value in your service, generate their interest, and then land conversations with them.
If your agency handles these conversations well, eventually, your team will get the opportunity to submit formal pitches to many businesses.
B. THE AGENCY PITCH
A good pitch demonstrates the agency’s unique value over its competitors and gives your prospect a taste of what they’ll get with your service.
In my humble (but accurate) opinion, the best way to accomplish this is with a deep-dive audit. This provides us with a concrete, transparent, and data-driven strategy.
*Warning: Even when you streamline, there’s no way around doing serious work here. So it’s important to weed out the “tire-kickers” during part A so that you’re only pitching businesses who are able and likely to do business with you.
The higher-quality your lead is, the more time you’ll likely be willing to spend on the speculative (unpaid) work.
Some or all of your audit process can be moved into a paid engagement. How much is up to you.
C. SERVICE DELIVERY
You’ve won the battle for your client . . . but the WAR is far from over.
Retaining an existing client is 10 times less expensive than finding a new one.
That’s why keeping good clients happy and winning their admiration and repeat business are the most important levers you can pull for long-term agency growth.
And to keep your clients happy, you need to get them results. What’s more, they need to consistently understand the value and impact of those results.
These days, you just can’t leave clients in the dark.
Be transparent, let them in on your process, and continually show them how you are progressing toward the end goal.
How are you going to do that? You got it baby – with DATA! :)
You’ll hit clients with regularly scheduled, high-quality reporting and insights to keep them in the loop.
D. REPEAT BUSINESS AND REFERRALS
If you’ve done A–C properly, you’ll more than likely be getting your clients great results.
If clients can understand those results, they’ll give you repeat business.
But that’s not all those results will do.
You have the power to amplify your agency’s authority and win more new business by showcasing the data.
You’ll want to wrap your results up with a bow – in the form of a beautiful case study.
Great case studies can be used as sales collateral with new prospects, submitted for industry awards, and showcased on your site.
If your client is part of the marketing department, they’ll also want to share your case studies with others in their organization.
This makes you and (more importantly) them look awesome.
Everybody wins.
Now that we’re all on the same page — here are the steps to build your agency data analysis engine:
Step 1 – Become the Expert in Your Client’s Industry With Data-Driven Competitive Intelligence
Before we begin, if you’d like to grab customizable Google Sheet and Data Studio templates that aggregate all the data sources below into one sexy report, just click below.
This will walk you through step by step and save you a ton of time formatting your data. Plus, you can easily customize the report to your liking and branding.
Here’s an example of how that report will look (mouse over to flip pages):
WHY COMPETITIVE INTELLIGENCE?
Competitive intelligence is crucial to our initial audit process.
By reverse-engineering our competitors, we can uncover whitespace, benchmark performance, and flesh out opportunities our clients should attack to build a winning strategy.
No matter what type of agency you are, getting familiar with the competitive lie of the land will help you master and disrupt your client’s market.
You can tailor your competitive analysis to the services your agency provides.
Here’s what we cover in most competitor audits:
BUSINESS DATA
The goal is to assess the business's position and actual growth trend.
Pull the business’s number of employees and employee growth trend (usually available from LinkedIn Premium’s company insights report).

Check the age of their site (we use the SEOQuake plugin), which can be a positive indicator for search engines as well as good general information.

You’ll also evaluate the overall value proposition of their business, products, and services through manual analysis of the copy on their Home, About, and product/service pages.
SHARE OF VOICE (SEARCH AND SOCIAL BRAND MENTIONS)
Analyzing top-line awareness can be a helpful starting point if you’re dealing with brands that already have a decent level of recognition.
In this context, “share of voice” refers to their relative portion of brand name searches or social mentions compared to the competition.
Searching for your client and their competitors’ brand names in Google Trends can give you a good indicator of the historic trend in share of voice.
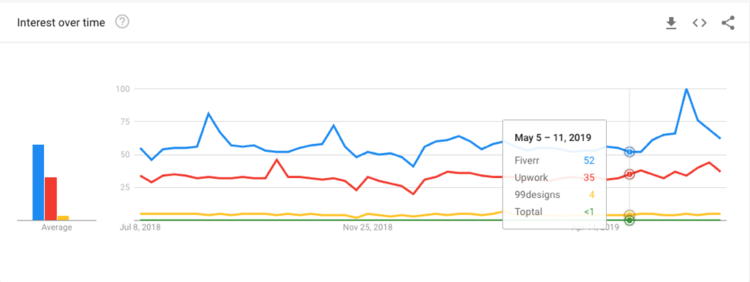
You can then cross-check for the volume of brand name searches for each competitor by checking Ahrefs’ Keyword Explorer tool.

A final “share of voice” indicator is the number of people mentioning each brand on social media. Grab mentions from your social listening tool of choice. For this, we like Awario.

BLOG CONTENT PERFORMANCE
Here, you’ll assess the level of sophistication you’re competing against – when it comes to the written word (blog articles).
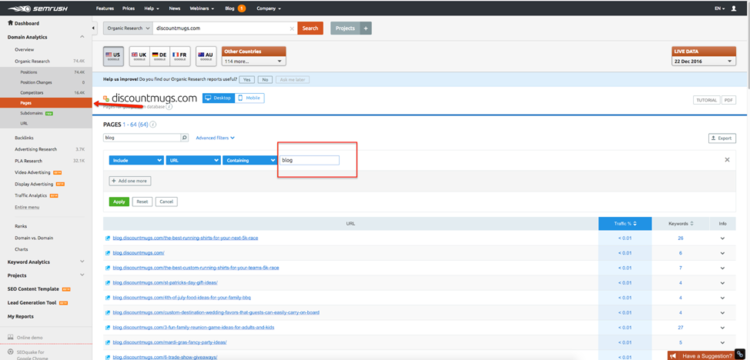
One of the first metrics you should check is each site’s frequency of blog articles per month (Google site: search).

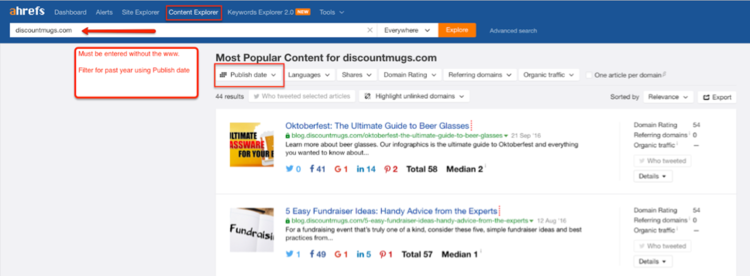
Break those top-performing articles down by the number of backlinks they have pointing to them and the number of social shares they’ve drawn (Ahrefs).
LEAD GENERATION STRATEGY
For lead gen sites like B2Bs, service providers, and SaaS (our bread and butter), it’s helpful to know the tactics competitors are using to generate their leads.
Compare each site’s “opt-in offer” side by side and assess the copy and type of content they’re using to generate their leads, AKA “lead magnets.”

Dig for any landing pages that are dedicated to opt-in, run the seo metrics on those pages and also check how much paid media is driving to those pages (SEMRush).
PAID MEDIA DATA
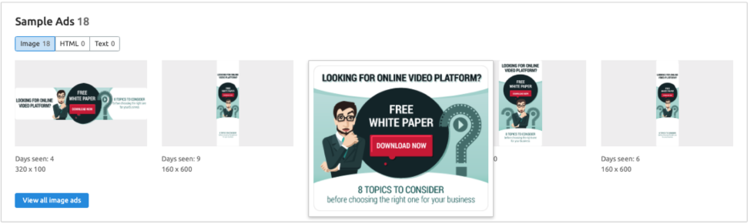
You can get a read on the amount each competitor spends on search ads (SEMRush) as well as the type of landing pages, copy, and ad imagery they’ve used in the past (SEMRush).

If you already have access to their Google Ads account, the “Auction Insights” report is a great way to gauge how their ads perform compared to competitors’.

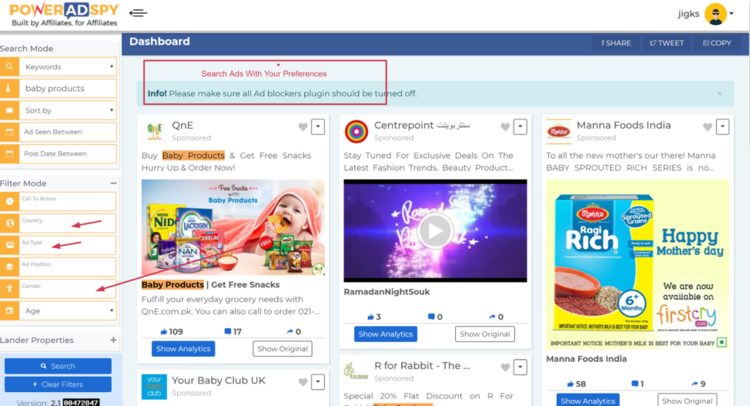
For paid social, we use Power Ads Spy, which allows you to see the Facebook ads that competitors have run and their landing pages.
SEO METRICS
Organic traffic volume and organic traffic cost are good base metrics on which to assess SEO for competitor sites (SEMRush Organic Research Report).
Traffic cost tells you how much your organic traffic is worth based on CPC data and is a good indicator of the monetary value of traffic.
Domain authority (mozbar) is another staple metric for your competitive analysis. A recent study on link building from Neil Patel showed DA as one of the top indicators of backlink quality.
If you’re considering a link-building campaign, linking root domains and link velocity or new links per month are crucial metrics to determine where you can realistically compete.
Find these metrics in Ahrefs.
SOCIAL CONTENT PERFORMANCE
Data on competitors’ social content and their audience’s response can give you powerful insights into your client’s brand, no matter what your agency creates.
For each brand’s Facebook, Instagram, YouTube, and LinkedIn accounts, we pull the volume of and trend in followers over time.
But more importantly, we look at three core social media KPIs – conversation, amplification, and applause.
Comparing the above metrics is a surefire spark for strategic thinking for your own content.
The SEMRush social media tracker reports can get you these metrics.

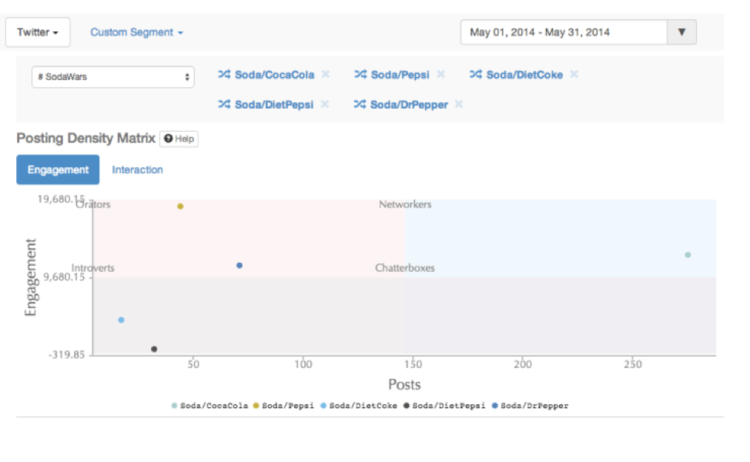
If you can spring for a dedicated tool, True Social Metrics is a great option with a few more bells, like the “posting density matrix,” which helps determine the competitors with the most effective posting schedule.
At the end of your competitive intelligence analysis, you should have a crystal-clear view of what your client’s market looks like and what it’s going to take to dominate that market.
You’ll now have a clear line of sight to the winning strategy.
Step 2 – Build Your Bulletproof, Data-Driven Strategy
S.W.O.T YOUR ANALYSIS
If you’ve crunched and analyzed the data points I’ve mentioned above, you’re now practically an expert on your client’s market. Kudos!
Now the job is to condense everything you’ve learned and pluck out the best opportunities for your client to start attacking in a way that they can easily understand.
Traditional SWOT (Strengths, Weaknesses, Opportunities, Threats) analysis is a great framework for this part.
It can also be helpful to set short-, mid- and long-term plans for your recommendations, since a lot of the time, some of your recommendations will be out of reach in the short term.
MODELING THE BUYER JOURNEY
You’ve identified the competitive whitespace and laid out opportunities in a data-driven and SMART way.
The next step will help demonstrate that you mean business and intend to follow through with your plan transparently.
This part will also set the stage for a healthy relationship with your client.
A relationship in which both parties are educated on how the marketing system works.
The buyer journey is a core, absolutely fundamental concept to any business.
But even the pros need a refresher, so I end up re-explaining the concept during almost every new engagement.
Left to their own devices, clients will default to “judging a fish for its ability to climb a tree.”
That’s why you want to make sure your agency and your clients have a clear understanding of how things work.
They need to understand the way good content and marketing bring customers closer to purchase.
AND precisely how this whole process should be measured.
First, for those who aren’t familiar, let’s break the buyer journey down quickly.
Buyers go through the same six-stage process when they do business with any company.
1. SEE – become aware of the business via content.
2. EXPLORE – research the business/product more deeply.
3. TRUST – decide the business is reputable enough.
4. TRY – give the business a shot.
5. BUY – make that first purchase.
6. ADVOCATE – repeat purchases and refer more business.
Granted, no one is identical, and there are infinite complexities between industries and companies. But in essence, that’s what it all boils down to.
Each of the stages above should have different business objectives, content, and KPI metrics.
You should set quantifiable targets and helpful segments for every KPI.
If you can present this model clearly when you start an engagement, your clients will know not to measure stage 1 content with stage 5 metrics.
If anyone starts judging a fish by its ability to climb trees, you can point right back to that model!
Sounds like a lot of work? No worries – I’ve made a plug-and-play Google Sheets template for you, with examples and video training, to help eliminate all the guesswork. :)

Step 3 - Forecast Marketing ROI for Your Strategy
You can blow smoke all you want. But when it comes down to it, businesses should really care about one thing – ROI.
If they can’t see how you’ll produce that metric for them, you’re not getting the business. Period.
But why then is it that agencies cower at the sound of those three letters? They’d certainly never bring it up proactively.
The avoidance generally comes from two things:
1. They don’t want to set themselves up for failure by overpromising.
2. They think it’s too hard to produce an accurate forecast.
But fortune favors the bold, my friend!
A data-backed, realistic ROI forecast is the absolute best way to overcome objections to investing in your service.
That’s why you’re going to be different and give this a shot.
“But Justin,” you say, “ROI analysis is REALLY hard. We’d need a scientist on board for that!”
No worries — I’ve got your back! Let me show you that projecting ROI doesn't have to be scary.
If you offer SEO services and you’re looking to get started with forecasting, try this Google Sheets and Google Data Studio template to get you started.
The model lays out multiple scenarios for what you can do for your client, including “Business as Usual,” which lays out normal growth without your service.
Here’s an example of how your projection will look:
*Mouse over the bottom left corner to flip pages
Step 4 – Retain More Clients with Ongoing Data Deliverables
WHY YOU NEED REGULAR REPORTING
The first three steps helped you WIN your clients’ trust and land them for ongoing services.
The way you deliver your service will determine whether you KEEP their trust and will determine their lifetime value as clients.
This is everything for your agency’s growth.
In order to stay happy, clients want to know that what you’re doing is having the desired impact.
They need to know that you’re progressing toward the goals/targets you laid out in your strategy.
And they want to see the actions you’re taking to progress toward those goals.
That’s why you need to hit clients with data at regular intervals.
Great reports can be the number-one factor separating AOR retainers from “flash-in-the-pan” projects.
In other words, the best thing you can do to grow your agency’s margins!
Here’s how you can create a reporting system that extends LTV for you and your clients.
TALK TO YOUR REPORT USERS
Your team and clients will love being hit with data deliverables, but only as often as they can provide value.
Otherwise, they might act like they smelled something foul when “reporting” comes up . . .
It’s a waste to create a one-size-fits-all report and deliver it to everyone in the business.
Your reports won’t get appreciated, and you have better use for your time.
Instead, you or your data person should sit down for a one-to-one chat with every individual who’s going to be using the reports.
That means people at your agency team AND with your client. But especially your client.
Probe them for their priorities and problems that can be solved with data.
Determine what’s most important for each of their roles and what they would consider to be a BIG WIN for this project.
Also probe for any potential anxieties about data and reporting. This can be a very sensitive topic for some, and it’s important to nip that in the bud.
This exercise will help the clients see you and your data as their partner and set the stage properly for an awesome relationship that’s driven by data.
DELIVER USERS ONLY THE DATA THEY NEED
The type, frequency, and granularity of data you deliver to people should depend on their role in the business.
The PPC manager, marketing director, and CEO each need a different granularity of data and analysis in order to do their jobs.
In general, the higher up in the org people are, the fewer metrics they should see, and the less frequently. But they need a higher level of strategic insight.
Hands-on PPC specialists, social media managers, etc. tend to need real-time access to data but have less of a need for all the insight.
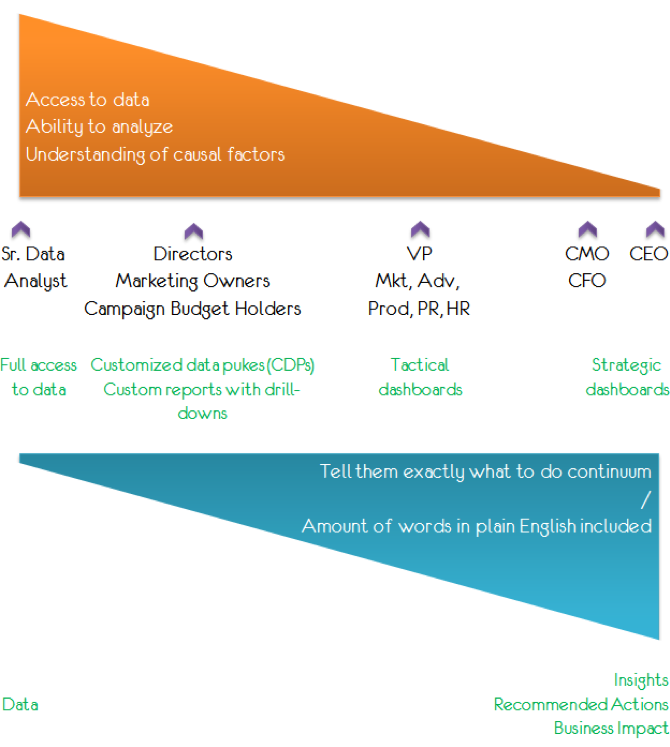
The above graphic is from a classic article I love on tactical dashboards from Avinash Kaushik’s Occam’s Razor.
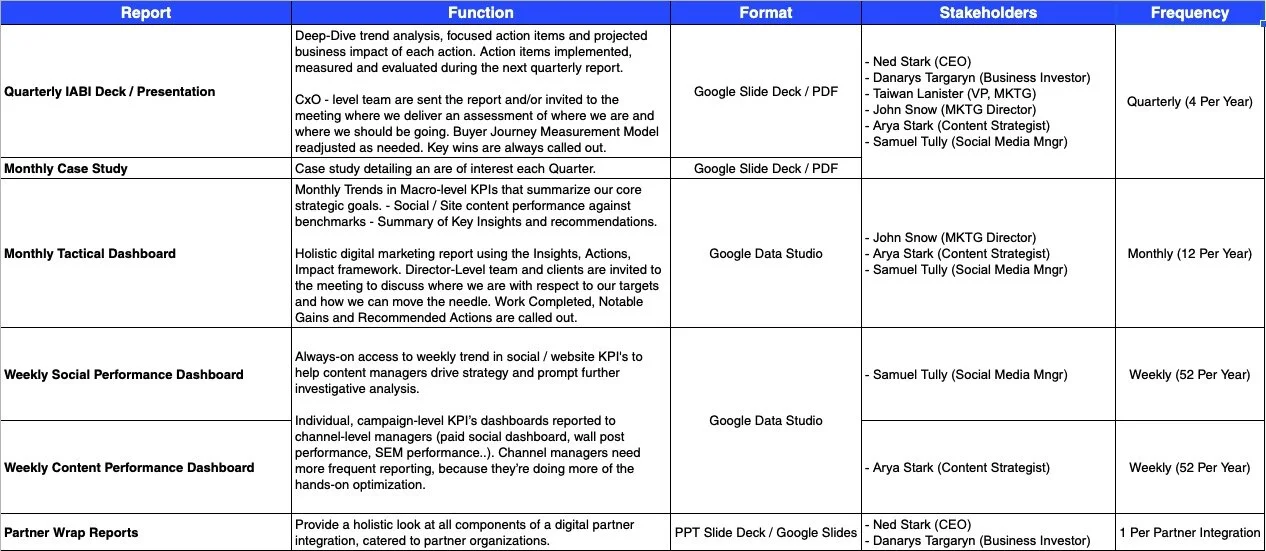
SET UP YOUR REPORTING CALENDAR
Schedule your reporting calendar based on your findings from stakeholder interviews and the resources you have available for data reporting and analysis.
In your calendar, you’ll want to note which stakeholders receive which reports and lay out the purpose/value of each report.
Step 5 – Wrap Up Your Best Results into Case Studies
If you’ve completed steps 1–3, you’ll at some point have recorded some outstanding, measurable wins for your clients.
You’ll want to shout those results out to your internal team, your clients, and the rest of the world!
This is a great way to celebrate success in using data to drive the business, sell data-driven thinking through to clients and prospects, and make your team look good in the process.
Case studies can be fantastic content to present prospective clients in all stages of their journey.
An aptitude for storytelling with your data will come in handy here.
YOUR CASE STUDY FRAMEWORK
1. Background – What state was the business in before your agency came into the picture?
2. Challenge – What was needed in order to put the business in an ideal state?
3. Solution – What specific tactics did your team recommend/employ to solve the challenge?
4. Outcomes – What impact did the solution have on business KPIs? (Include a chart/visual.)
5. Next Steps – How should/will the business use this case to drive further growth?
Here are some examples of how you can use your new case study:
External Promotion (provided client approves)
- Submit the case study for industry awards.
- Include it in a section on your website.
- Put it on service-specific landing pages.
Internal Use
- Company newsletter
- Section on your intranet
- Quarterly meeting
Now Let’s Scale Your Analysis Workflow to the Big Leagues …
How to Build your agency a scalable, automated data engine
This five-step process probably sounds like a decent amount of work . . .
Done properly, it is. At first.
But what if you had a stack of tools that let you easily scale this process to 40, 50, 100+ clients?
A data ENGINE that gets all this done efficiently, without hiring ANY new people or using your people’s time on tedious data tasks?
Well, you can.
With the right process and tools dialed in, you can run clients through the system like clockwork, without batting an eye.
You’ll be able to scale the service infinitely and watch client lifetime value go through the roof. Guaranteed.
If you want to join the data analysis big leagues, the trick is to “codify” your process by tapping into APIs for all the sources we’ve mentioned and automating data scrapes.
Here’s the stack of tools you’ll need:
1. AN ETL (EXTRACT, TRANSFORM, LOAD) TOOL
ETL tools like Supermetrics and Stitch help you run data queries on a schedule, eliminating the need to log into your different sources to manually “pull” data.
2. A DATA VISUALIZATION TOOL
The only way to scale reporting and dashboards in a beautiful, easily understood, and actionable way is through Data Viz Tools like Google Data Studio and Tableau.
3. A DATA WAREHOUSE
If you’re doing data analysis at high volume and need a process joining different data sources together, then you should be using a data warehouse like Google BigQuery.
Once you have these three things properly in place, you’ll NEVER have a problem scaling your services and keeping clients happy with data.
If your team has or wants to hire a full-time data engineer to build this, make sure they are versed in SQL.
Or just hire us to build the engine for you, at a fraction of the cost of a full-time analyst, and never worry about spinning your wheels with data, ever again.
Even if data work isn’t necessarily your team’s kryptonite, please make sure they spend time on what’s important – the INSIGHTS – and as little time as possible on capturing and cleaning data.
If you do that, your data will have the desired impact on your clients, their results, and their lifetime value with your business. As an ancillary benefit, your team gets to keep their sanity — no more data grunt work! Phew.
Again, everybody wins :)
Wrapping It Up
By now, you should have all the tools and resources you need to land more big-fish clients, gain their trust, and increase their lifetime value with a highly scalable, data-driven system.
No matter what type of services your agency provides, using data wisely will drive massive lifts in every part of the sales cycle.
Whether you consider yourself left- or right-brained, always remember that data is your friend.
So get out there and leverage it to drive more business!
Happy analyzing!
Is your agency’s process for using data any different? How is it working out for you? Let us know in the comments section below.
Building your data pipeline?
We’re happy to help map out your options.
Book some time to connect with Justin, founder and lead consultant @ JourneyEngine.
With Love,
The JourneyEngine Team