SaaS Dashboards Made Easy – Build Your Automated KPI Engine
Table of Contents
To keep your edge in the SaaS world, you need to be able to quickly and accurately answer a number of key business questions;
⚙️ Am I spending too much to acquire subscribers? If so - why?
⚙️ How much profit am I making on each plan type?
⚙️ What type of users are churning? Why are they churning?
⚙️ How will different growth, marketing spend and hiring scenarios affect our business?
As an SaaS marketer, you don’t have time to wait days or weeks for your analyst to return with the answers to these questions.
But that’s the case far too often.
It’s because there’s no individual data source that can provide the answer to these questions.
And the bits of necessary context are always missing;
🚫 Your subscription data can’t tell you how much profit you are making on each plan type, user or marketing channel
🚫 Your churn reports don’t tell you what types of users that are churning
🚫 There’s no forecasting tool that will let you to play out different scenarios to see their impact on your business
The typical analyst’s remedy is to dig into multiple data sources, stitch those sources together with their own logic and formulas, then make an effort to form a story about your buyers.
This process is time consuming, prone to error and filled with potential headaches.
Not fun!
That’s why it’s critical for your team to develop one clear framework around how you approach data analysis.
Intro to the SaaS Data Pipeline
A data pipeline is more than a tool or software.
It is the path to analysis freedom for SaaS marketers and stakeholders.
The pipeline is a framework for joining your raw data sources together, doing predefined math and then visualizing your data in a way that your team can easily use it.
It’s an ecosystem that connects ALL of your business’s technology together into a single source of truth that surfaces only what’s valuable to you.
You set it up ONCE. The end result?
👉 Your data refreshes automatically, on a timeline of your choosing (hourly, daily, weekly).
👉 Your data is visualization-ready - it can be used in your dashboarding tool of choice (Data Studio, Sheets, Tableau, Looker, etc.).
👉 Everyone on the team uses a single, cleaned data source. At all times. No more discussion about why one dataset doesn’t match another.
👉 Data Users (marketers, product managers, etc.) are free to explore + analyze data. With no worries about breaking anything.
Below, we’ll dive into the nuts and bolts of how to build this awesome framework into your SaaS business.
Here’s what you’ll learn;
✅ The KPI’s and Segments you should be analyzing for different areas of the business; Sales, Marketing, Operations, Product.
✅ The basics of how Data Pipelines work.
✅ The technology stack you’ll use to automate your analysis workflow. Permanently!
Sound good? Alright, Let’s begin!
The Best SAAS KPIs and Segments for Your Dashboards
The most important lesson we’ve learned as marketers and analysts is that when it comes to data.
Less is more!
Providing your team a dashboard with too many metrics is a quick way to get ignored.
“Cutting the fat” is the first step to building an effective analysis workflow.
If a metric doesn’t answer an important business question it’s not a “KPI” and it shouldn’t be included in your dashboard.
The next section covers the key KPI metrics and types of analysis you can leverage to skyrocket your value as a SaaS marketer.
Then in the following section, we’ll show you how to work those into your automated KPI Engine.
SaaS Acquisition Metrics
Your acquisition analysis provides insight into the effectiveness of your marketing campaigns. You’ll quickly be able to see whether your content is compelling and how users discover your product.
Customer Acquisition Cost (CAC) + Lifetime Value (LTV)
With accurate CAC + LTV analysis, you’ll be able to answer perhaps the most critical question in SaaS acquisition;

Analyzing your customer acquisition cost will tell you;
How much it costs to acquire new customers
How much it costs to keep existing customers
For this analysis, you’ll need to synch up datasets from different ad platforms (like FB Ads, Google Ads, etc.).
It’s fairly easy to get your CAC number from standard tools. But there’s much more important context you need that you can’t get so easily;
1. You need to know how much each customer has spent over their lifetime (not just during their last transaction).
2. You need to know whether your ads were truly driving new users or merely helping convince new users to upgrade.
For that “Lifetime Value” data, you’ll need to join in your conversion attribution (Google Analytics) and downstream payment processing (e.g., Stripe).
Combining LTV to come up with a target CAC will give you the baseline to judge all of marketing efforts and will fuel the rest of your analysis engine.
Want a template to build your own CAC profitability? Grab this CAC profitability and cohort analysis template from Dan Martell at Blackwell and Christoph Janz @ point Nine Capital:
SaaS Conversion and Sales Metrics
Your Sales metrics are they key to understanding how effectively your business is converting leads into buyers.
Trial versus Paid Rate

Are demos and free trials converting into paid subscriptions? Or do your campaigns drive users who never actually convert?
Trial users can be your best friends or they can destroy your margins, depending on whether they convert. Remember that even trial users can deplete your support staff and other resources.
If your trial users aren’t converting to paid customers at an acceptable rate, you need to understand why. It could be a red flag of a weak product to market fit, or another bottleneck in your funnel.
You should segment this metric by your marketing channels, campaigns and content to make decisions about where to pour fuel and where to pump the breaks.
User Cohort Analysis
Study your monthly performance from trial subscribers to paid users compared to your overall retention rates.
Instead of tracking your user base as a whole, viewing a grid of cohorts can show you how changes in your product positioning and messaging over time influences your revenues.
You should segment your cohort analysis by acquisition channels (Facebook ads, Organic Search.. etc) and by your SaaS product usage metrics for greater insight into your marketing success.
SaaS Marketing Automation Analysis
Relationship-building through email is absolutely critical, perhaps more so for SaaS marketers than any other niche.
Your analysis should allow you to easily drill-down the performance of your customer journeys and tell you which campaigns prompted lifts in conversion and product usage.
Segment your SaaS product usage metrics against email messages to determine which campaigns are driving users to interact with your product’s most important features.

SaaS Product Usage Metrics

Are your product’s features moving users to convert? Or are they just a waste of space?
Using event data collected from Mixpanel, Segment, or another method will highlight which areas of your product are activating users.
You can use feature-level data to tweak your product roadmaps and measure the response from users whenever you launch a new feature.
Trial vs Product Qualified Leads (PQLs)
Our friends at Chameleon define PQL as “a free or trial account that has gotten to a point of initial value with your product”. Make sure to check out their comprehensive guide on how to measure Product Qualified leads.
A lead becomes “product qualified” when they have reached pre-defined triggers that signify a strong likelihood to become a paying customer, such as;
Account created
Invited 2+ team members
Created project
Uploaded 2+ files
Created 3+ calendar events
Created 1+ tasks
Completed 1+ tasks
These users already received meaningful value from your product and, as such, are more likely to convert to paying customers.
Every customer journey is different, so finding the data points that identify PQLs will be different for every business.

A PQL for your business could be a user who completed a key action during their trial, completed a series of key actions, or spent a certain amount of time within the app.
The rate of sign ups to PQL’s will help you determine whether your product features and content messaging deliver enough value to upgrade your leads to qualified buyers.
SaaS Operating Metrics
Your SaaS operating metrics can help you find an optimal economic model for current operations and future expansion.
Finding the relationship between growth (revenues) and the marketing spend to acquire one dollar of additional revenue gives you a clear and concise view of your team’s performance.
Churn / Retention Analysis

Are my users staying loyal? Or do they quickly bounce from the product?
It’s a known fact that keeping existing users is cheaper than earning new ones.
That’s why analyzing churn is one of the most important things you can do.
Churn rate is the proportion of customers who leave during a given time period. It is often an indicator for customer dissatisfaction, cheaper and/or better offers, or reasons outside of your control like business failure or strategy shifts.
Looking at your “top-level” churn number is helpful, but insufficient. Alone, it won’t give you the context you need to understand why users are churning.
You need to understand the difference between users who churn and those who remain loyal. What features they use, what marketing channels and campaigns they have touched, etc.
Once you understand the difference between these segments, you’ll know what you can do to move the churn needle in the right direction.
Forecasting + Burn Rate Analysis
How can distributing your media mix differently impact your overall revenue? How will different hiring scenarios affect your margins?
If you’ve raised money, knowing this information will be especially critical. Your investors will thank you for giving them accurate burn rates and a variety of scenarios to make your operations more efficient.
It will give you a clear understanding of how your cash position changes using different strategies and help you determine when you should target the next round of fundraising.
Click below to get an awesome template to help you with financial modeling & Valuation (from Dan Martell @ Blackwell):
SaaS Metrics Definitions and Benchmarks
For every KPI, you’ll want to set a manageable benchmark.
Without targets, you’re flying blind - you will never know whether to throw a party or go back to the drawing board.
The cheat sheet below is a classic from Joel York @ Chaotic Flow. It runs through the types of analysis we’ve covered thus far and provides an awesome baseline for benchmarking.
SaaS Metrics Cheat Sheet
If you’re just getting started, you can download this cheat sheet with benchmarks to help set your own baselines -

Your Automated SaaS KPI Engine
Alright, if you didn’t already, you should now know exactly what to measure.
Now for the fun part.. automating your analysis!
Before you start building an automated data pipeline, you’ll need to understand what it is and how it flows.
How a Data Pipeline Flows
A data pipeline is more than a tool or piece of technology.
It is a system that frees you from the tedium of collecting and analyzing ALL of the different datasets you need to answer the business questions we’ve covered and more.
Your “pipeline” grabs data from its original sources and delivers it into a data warehouse, where it can be processed, analyzed and visualized to your heart’s desire.
Automating the flow of your data sources into a single database will help you:
Establish a single source for all the raw data your team uses.
Apply standardized logic to join datasets to calculate KPI’s that answer your business questions.
Format the data into intelligent reports that all of your stakeholders can easily use and apply.
The SaaS Analytics Software Stack to Set you Free
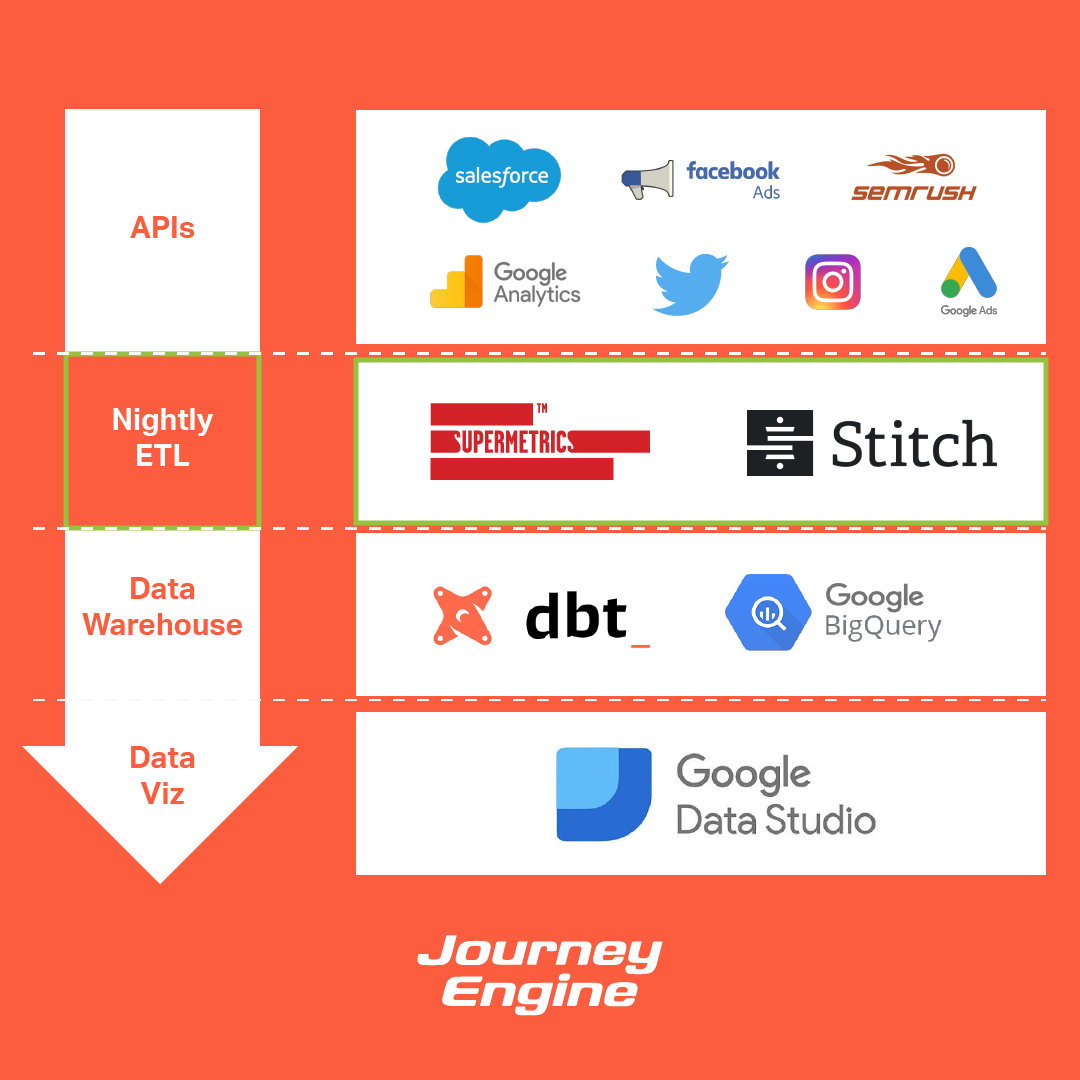
There are four components you’ll need to setup your data pipeline;
Your Data Feeds
An ETL software
A Data Warehouse
A Dashboard / Data Viz Tool
How to Build Your Data Pipeline
Here are the steps you’ll follow to build your engine:
1. Select Your Data Feeds
The first thing you need to do is select the data sources that will be part of your pipeline.
You’ll need to have access to all the important tools your team regularly uses to analyze data.
The possibilities are endless as every team’s software stack will be different. Here are the categories we come across most often;
Common SaaS data sources include:
Payment processing solutions like Stripe.
Subscription management software like Recurly.
Email Service Provider (ESP) and campaign management solutions like Drip.
Different ad platforms, including Facebook Ads, Google Ads or others.
The site user statistics from Google Analytics or Adobe.
Product and event analytics, including Intercom, Mixpanel, or Segment.
Your goal is to grab only the data you need from each of these platforms automatically, on a schedule, so that it can be transferred to your data warehouse.
Each of these sources has an “API” (Application Programming Interface) that you can access to pull your data from.
ETL (Extract, Transform, Load) software helps you do this automatically, on a predetermined schedule.
2. Setup Your ETL Software
Four solutions provide similar functionality while having slightly different pricing models. You can opt for Supermetrics, Fivetran, or Stitch as your ETL solution.
Internally, we use Stitch and Supermetrics for Google Sheets, which has been tremendously effective at the lowest possible cost for our clients.
Your ETL software will help you to turn those raw data sources into curated datasets that can be stored in your data warehouse.
3. Build Your Data Warehouse
Your data warehouse is the happy home where all of your data from different sources lives together, in harmony.
There are many data warehouse options, the most popular being Amazon Redshift, Snowflake and Google BigQuery.
At JourneyEngine we prefer BigQuery for our Data Pipeline service, for three reasons;
BigQuery integrates with the entire Google stack of analytics tools, including Sheets, Data Studio, and Google’s Cloud Platform.
It’s extremely fast, and you can scale your data sources to any size.
You get an affordable solution suitable for startups, with BigQuery costing $0 while allowing your team to scale in storage and query sizes.
If you are heavy Google Sheets users like us, it would be silly for you to use any other data warehouse than BigQuery.
Once you get all of your data into your warehouse, your’e still not quite there yet.
In order to turn your warehouse into the single source of truth for all of your businesses data, you need combine that raw data with business logic (math).
That’s where data modeling comes in!
4. Automate Your SQL Models
Different people on your team will process data in different ways and use different formulas which will lead them to different results.
Data modeling software allows you to define your business logic into a single set of automated SQL queries, instead of using disparate spreadsheets and formulas.
This is the single biggest benefit of a data pipeline, as it gives you a single place where you can modify your logic and inform all subsequent reporting.
A single source of truth gives you additional capabilities to understand the following questions:
Which of your conversion goals (from Facebook or Google Ads) correspond to MQL’s and PQL’s?
Which data source from Google Analytics informs your most successful marketing channels?
Which accounts for paid media belong to the same site, store, or client?
At JourneyEngine, we use a modeling framework called DBT to achieve this. It allows us to run SQL models on any schedule or on-demand.
DBT helps us bring an engineering flow to data analytics. Kind of like the workflow your team uses to build software.
It gives us the ability to store all SQL models in a Github repository with full access to version history.
When your SQL model runs, it updates everything in your Git repo.
You’ll be able to see the updated data in the warehouse and understand what logic generated your latest datasets.
4. Build Your Dashboards

Your visuals are the face of your underlying data engine.
Just your car’s engine, the driver needs a dashboard to understand when to hit the gas or pump the brakes.
If you’ve made it this far, building dashboards is the easiest part — your victory lap!
The most popular visualization tools are Data Studio, Tableau and Looker. At JourneyEngine, we love Data Studio.
If you’re already using a dashboard tool, you can continue using the same one with your pipeline.
The Final Word
We’ve explored KPI’s that are critically important to SaaS marketers and given you a framework to codify and automate the way you analyze them.
But it’s important to note that there isn’t one pipeline that will work for every business.
So don’t look at this as a 1:1 recipe, but a way of thinking — a framework for the way you approach SaaS data analysis.
The data sources, metrics and tool stack will be a little different for every business.
The main thing to remember is that everyone should be working from a single dataset generated by your new pipeline. One “source of truth” that’s standardized and automated in a way that the entire business can have confidence in.
This system forces everyone to make decisions based on the same data.
It enables individuals to be creative while the company keeps track of business goals and makes strategic changes to their models.
Your teams can explore real-time data without the fear of breaking the underlying analytics engine.
Trust me when I say that this is the ONLY way to do analytics of real value at any large scale.
So don’t settle for anything less in your business.
Are you Building an SaaS Data Engine?
We’re happy to help map your options, build more accurate models, and make better decisions about resource allocation in the future using SaaS analytics software.
Check out our Analytics Automation Service for more info, or download our info deck.
Have specific questions about your pipeline? I’m happy to help lay your options out and work through any bottlenecks.

With love,
Justin from JourneyEngine