SEO Benchmarks For EdTech Companies
What an exciting time to be in EdTech!
Funding, exposure and unreal growth are in abundance. Feels like we’re entering a new age of education.
Making it the perfect opportunity to take stock.
How are Your Ed Tech company's SEO and Content marketing performing against sites that share similar size and ranking power?
Fortunately, our engineers built a tool that answers that question directly:
Continue reading to find out how to use it (takes less than 5 mins). Or watch the video below…
Want to know exactly how much you stand to improve and how to edge out these competitors right now?
The EdTech benchmarking tool is great.. but my team and I want to take a much deeper look at your site (still free)! If you qualify, we’re going to give you an Organic Traffic Projection report and strategy customized for your business.👐🔮 Check that out here:
Want a free product-led content strategy for your EdTech business?
We’ll give you the blueprint + forecast the results..
Now back to the benchmarking tool..
If you’re in a marketing function at an EdTech company, then pay close attention.
You’re about to discover exactly how to scale up your organic content efforts. First, let’s look at the metrics we analyzed.
Table of Contents
SEO Metrics for Ed Tech Companies
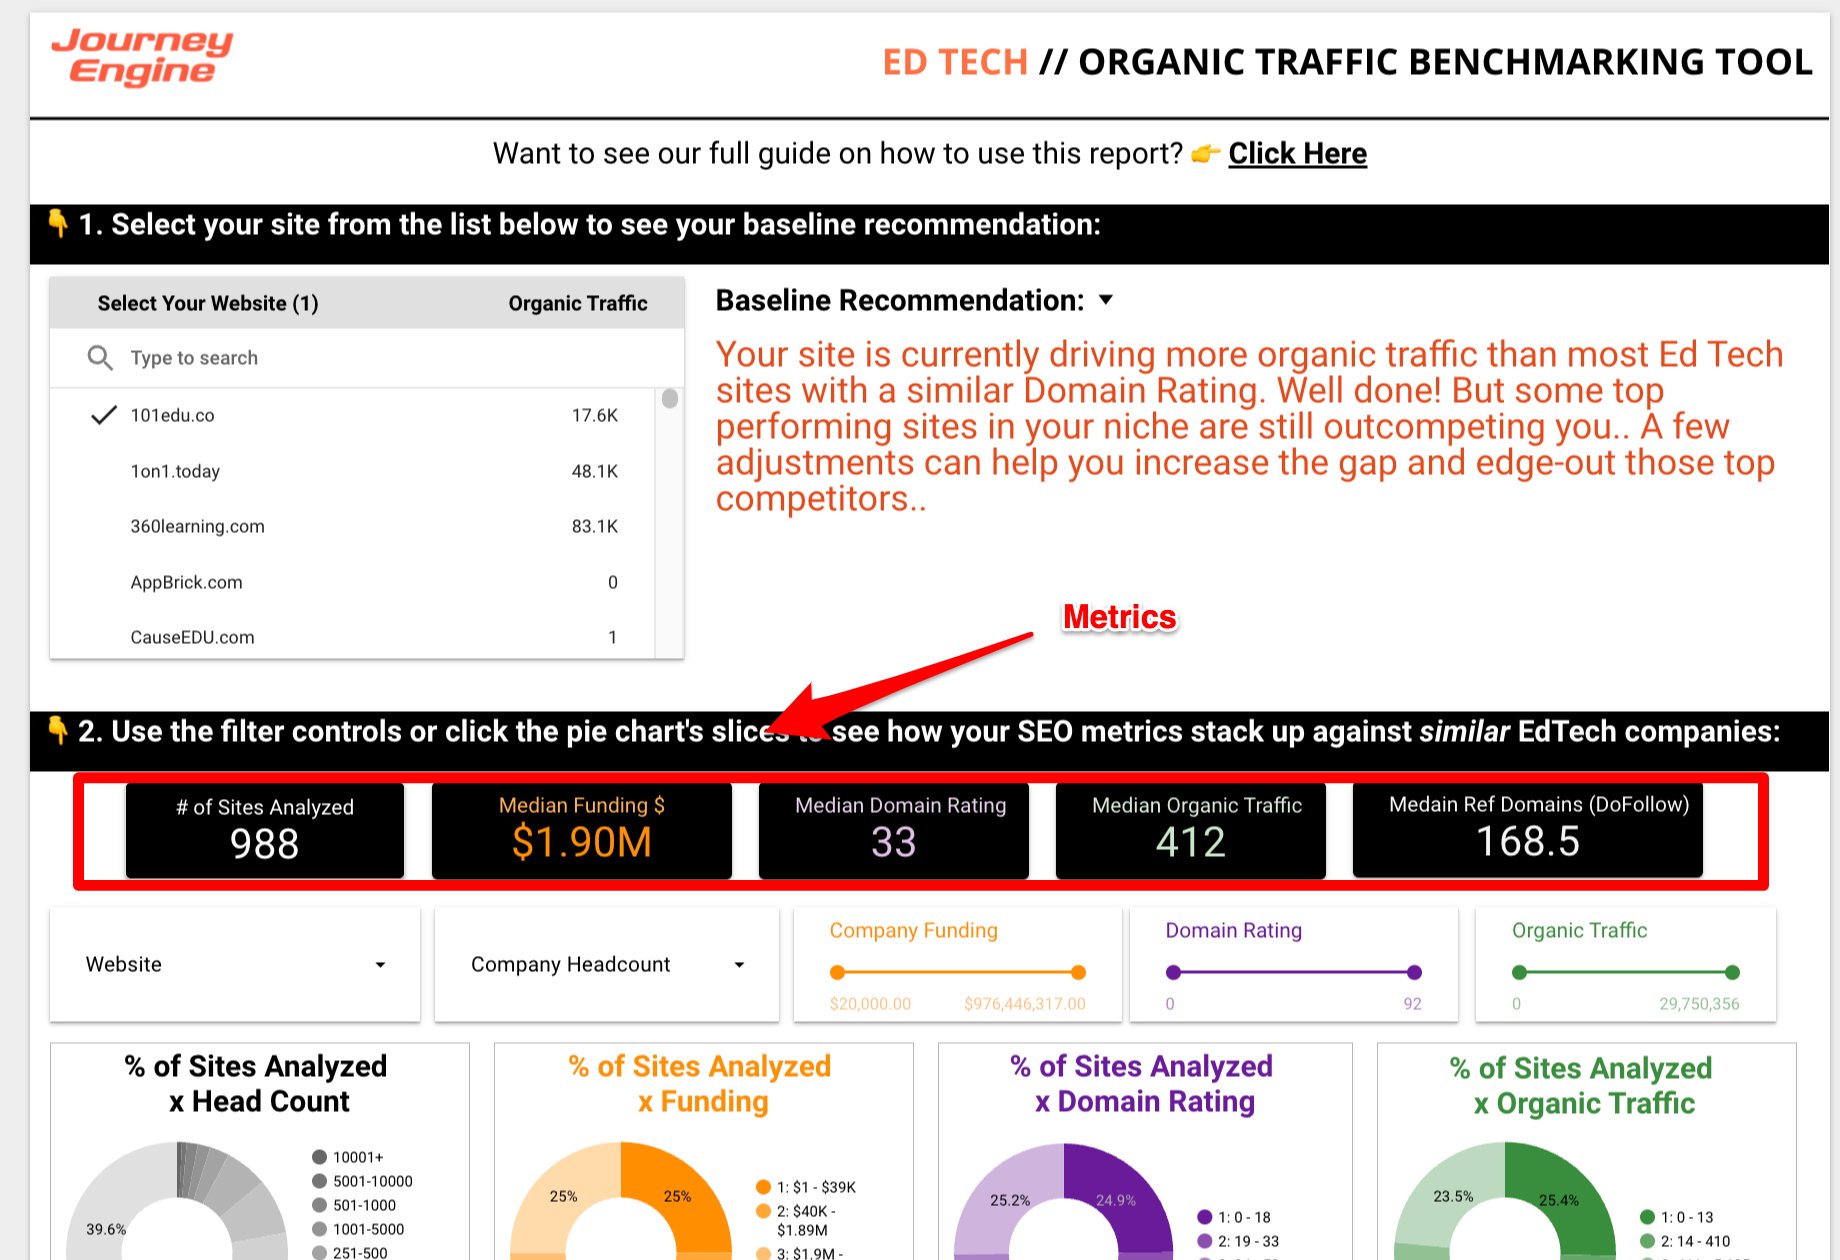
We analyzed 988 EdTech websites. Here’s what we looked at…
Employee headcount: LinkedIn
Company funding: Crunchbase
Domain rating: Ahrefs
Organic traffic: Ahrefs
Employee headcount and company funding are pretty self explanatory.
The metrics related to your SEO efforts are domain rating and organic traffic.
Here’s what they mean…
Domain rating definition
Measures your website's ability to rank for competitive keywords on a scale from one to 100.
The higher you are on that scale, the more power you have to rank in search engines.
This is a function of the quality and the number of other websites that are linking back to your website.
A website with 0 DR probably won’t rank for anything significant.
A website with 100 DR should rank page 1 for the most competitive keywords. Every piece of content is a surefire “win” right out the gate.
Organic Traffic definition
Your non-paid traffic from search engines every month.
It’s essentially the “free traffic” Google sends to your site.
How To Use The Tool
Step 1 - Find your website
Use the search function to find your website. Then click on it.
If you don’t see your website here email us at (justin@journeyengine.com) and we’ll add you.
Step 2 - View Your Baseline Insight
Your baseline insight is an overarching recommendation. It shows you…
Where you stand against your closest competitors
What direct SEO actions you should take to get ahead of them
Example 1 - Content Strategy for EdTech
You can see the website 1on1.today is driving more organic traffic than most EdTech sites with a similar domain rating.
However there are still some sites in the niche that are outcompeting them.
In order to edge-out the remaining competitors, this site should;
Note the websites in their DR “Quartile” range that are driving more organic traffic
Plug each site into an SEO competitive intelligence tool like Ahrefs or SEMRush
Locate the content and keyword gaps that are helping these competitors drive more organic traffic
Use these insights to optimize existing content and build new content that will capture remaining market share from your competition
Example 2 - PR for EdTech Websites
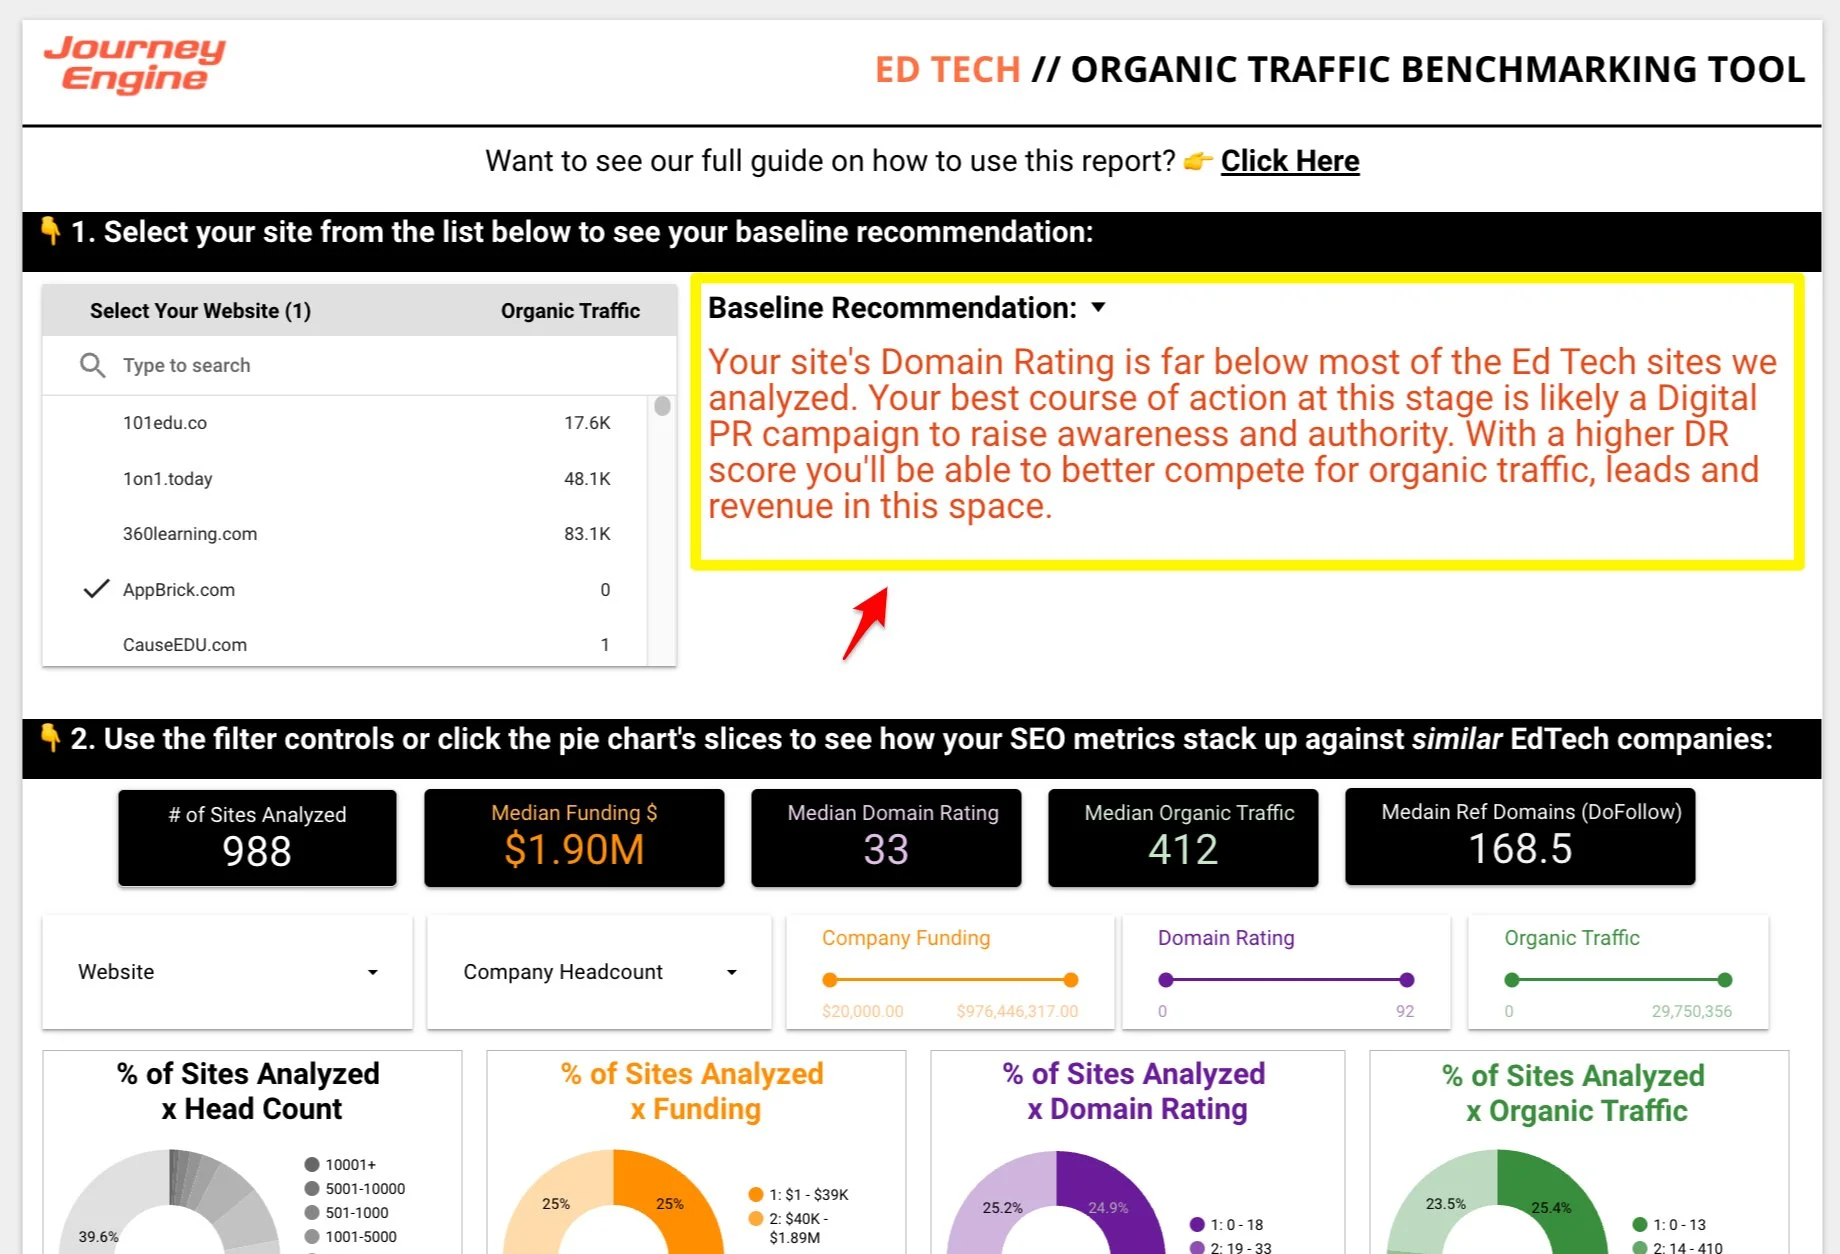
On the other hand, Appbrick’s Domain Rating is far below most of the Ed Tech sites we analyzed.
Their best course of action at this stage may be a Digital PR campaign to raise awareness and authority.
With a higher DR score they’ll be able to better compete for organic traffic, leads and revenue in this space.
Step 3 - Other EdTech Website Benchmarks
You can filter the data based on any metric.
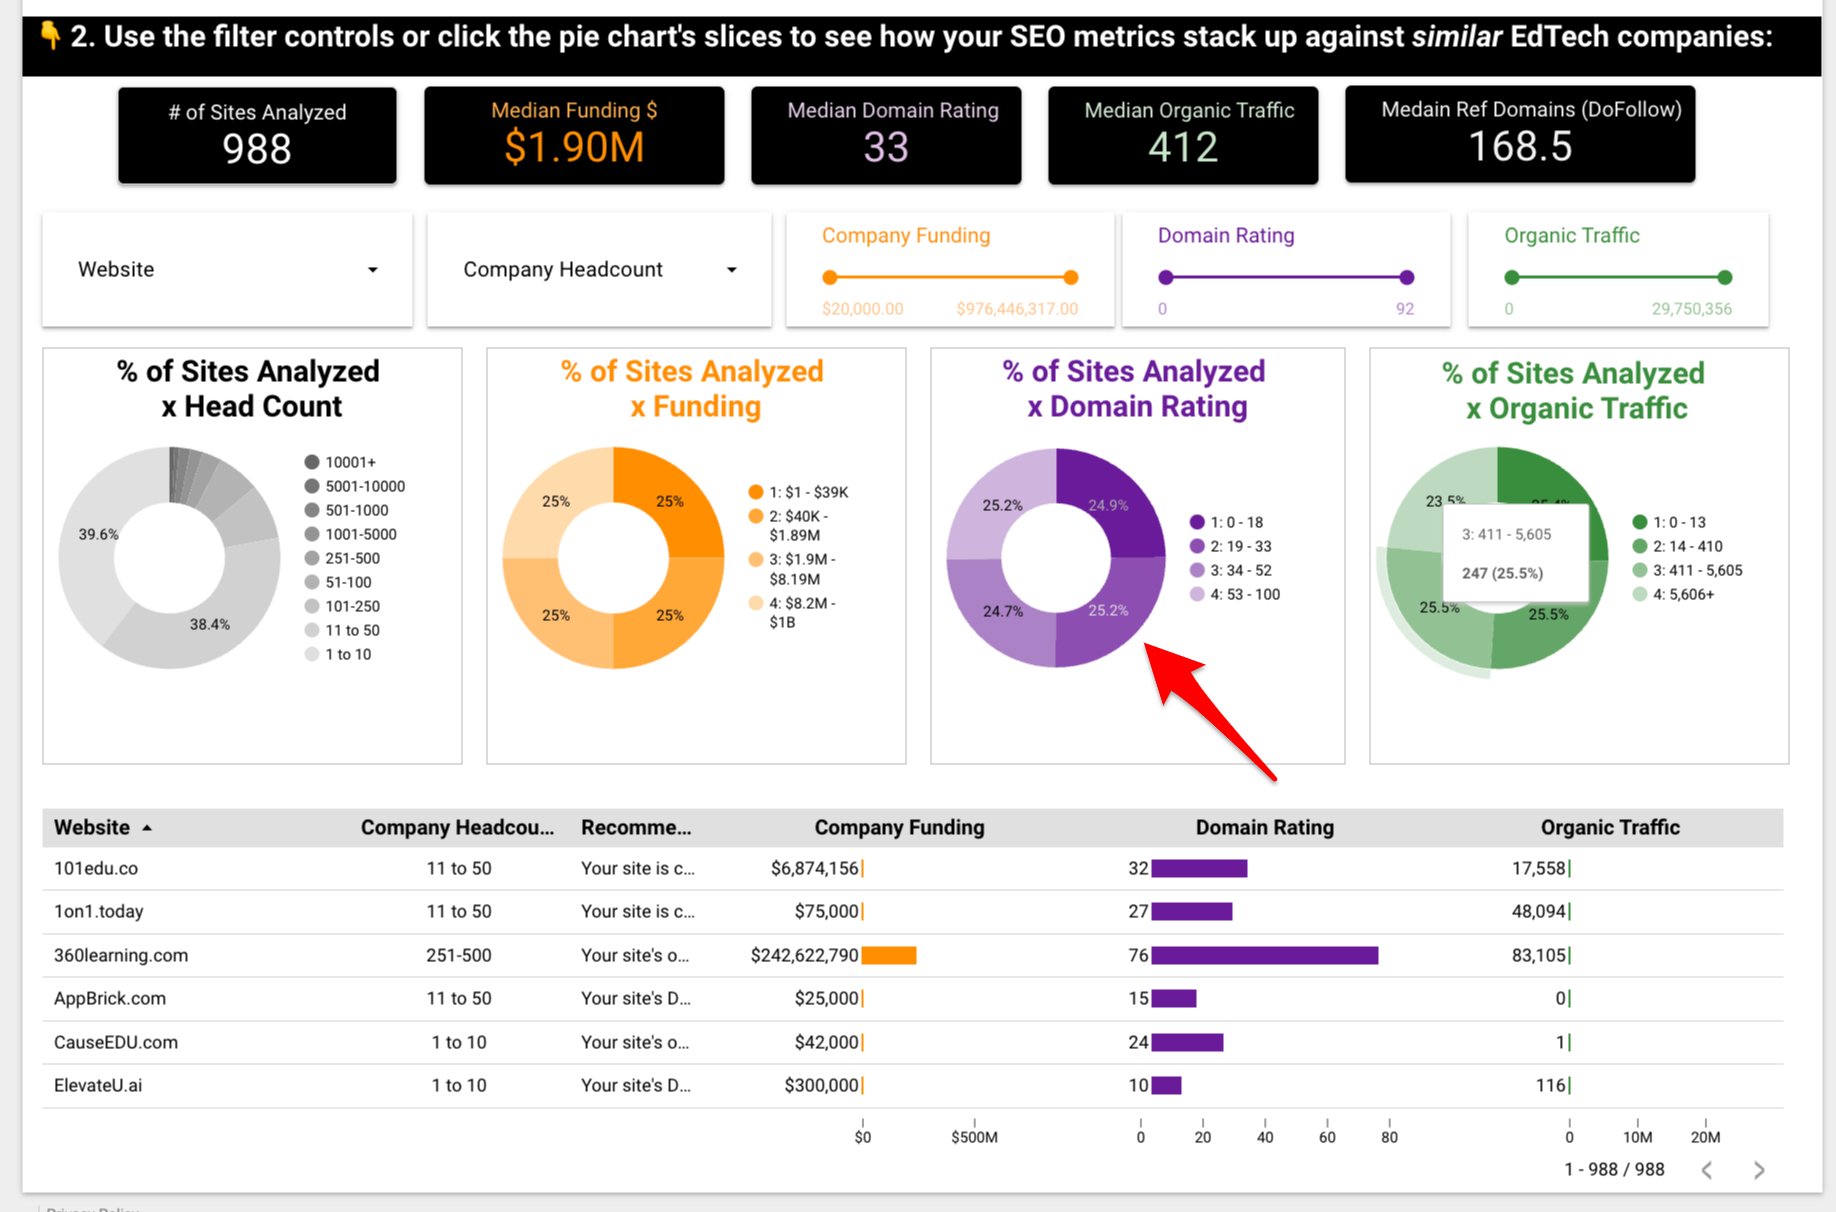
Here’s how you filter for domain rating.
You can see that the DR for 1on1.today is 27.
The 4 pie charts have been separated into equal quartiles: groups that are similar in profile to ours on each of these metrics.
Locate the relevant group (which is anything with a domain rating of 19 to 33).
Click that slice of the pie. That filters the entire dashboard for only EdTech sites with a DR of 19 to 32 sessions per month.
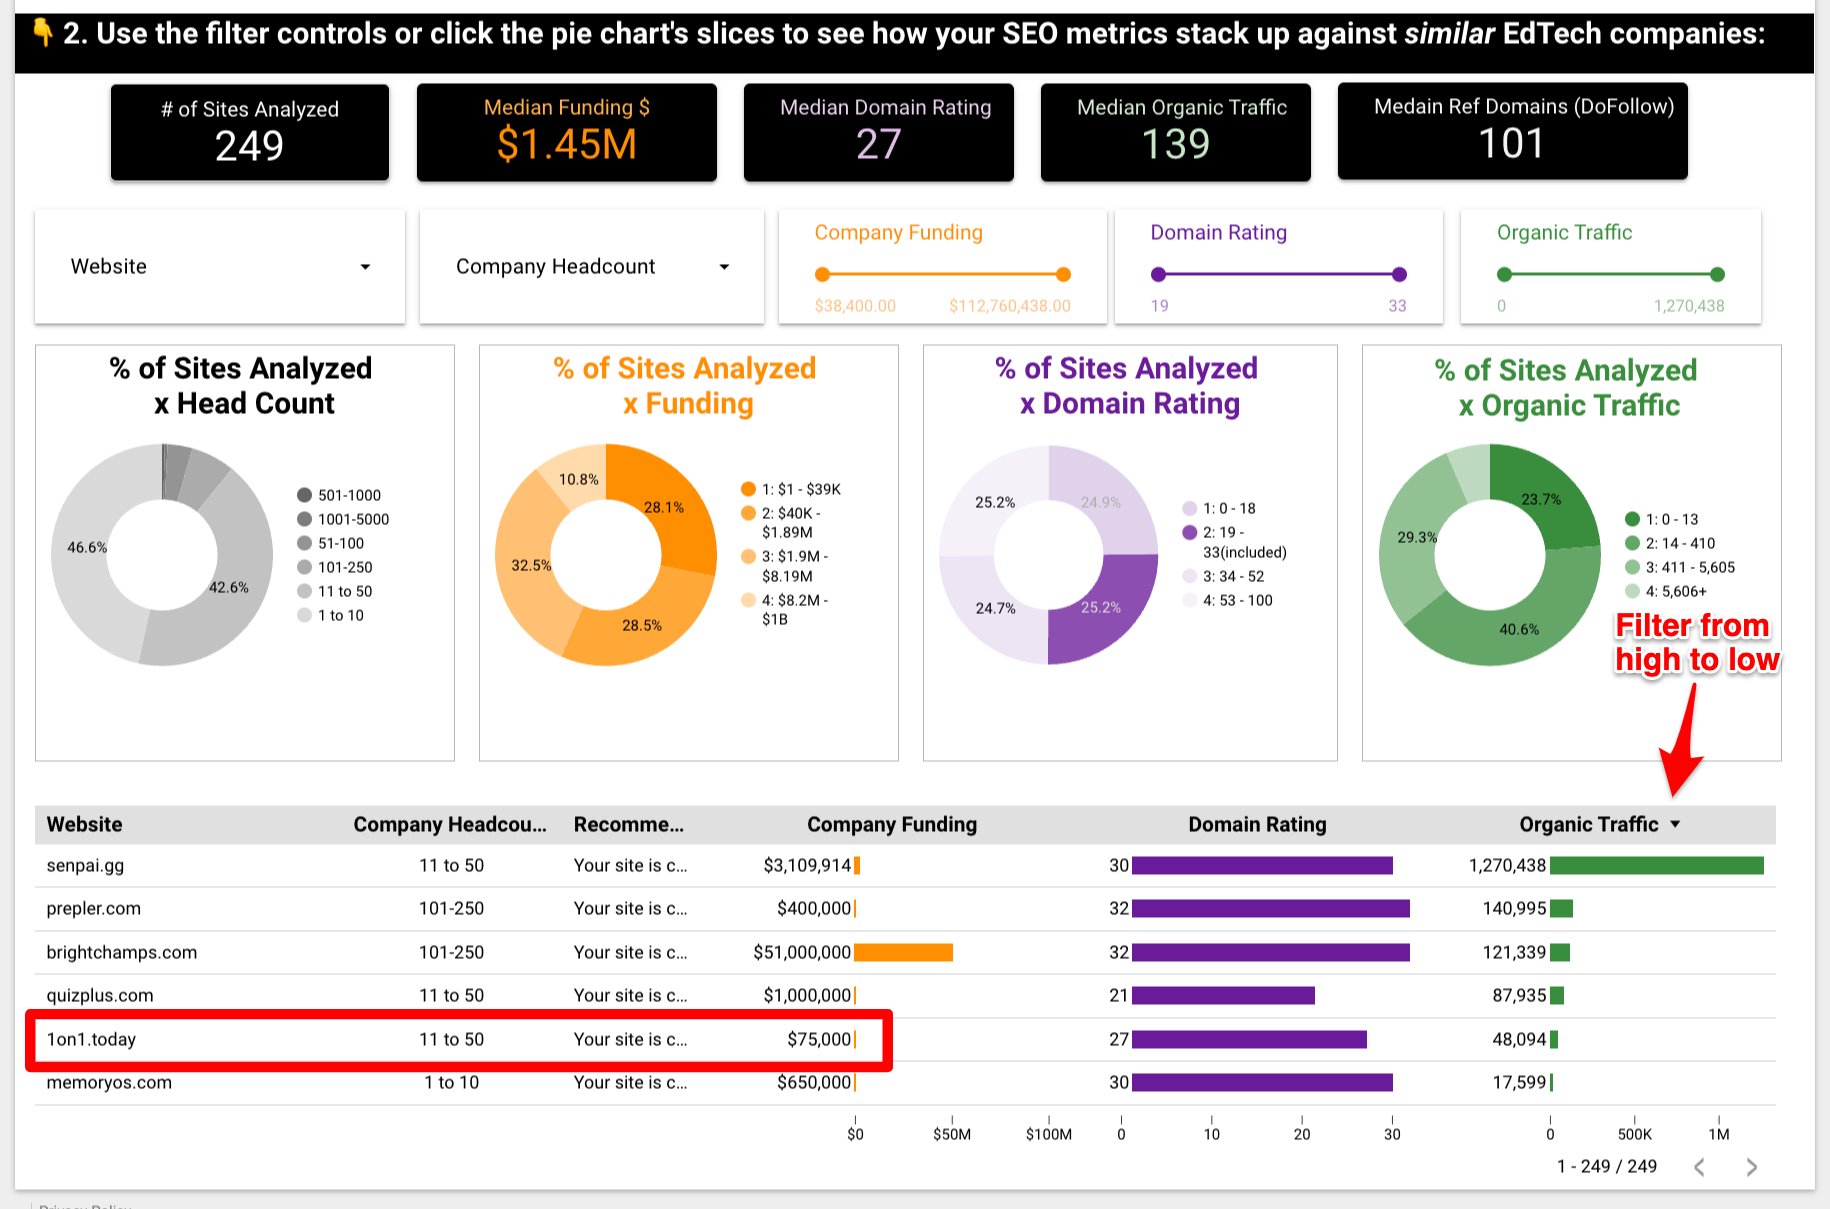
You can see that companies with this DR typically have:
Funding of $1.45m
1-10 people in headcount (46.6%) or 11-50 (42.6%)
139 organic sessions
101 backlinks
In 1on1’s case if we filter for organic traffic you can see they are close to the top.
But there are still a few sites that are outcompeting them (Quizplus, Brightchamps, Prepler and Senpai).
So they might want to check out those websites. See what they’re doing content / keywords wise. Then try to replicate or outdo them.
This tool works from any metric.
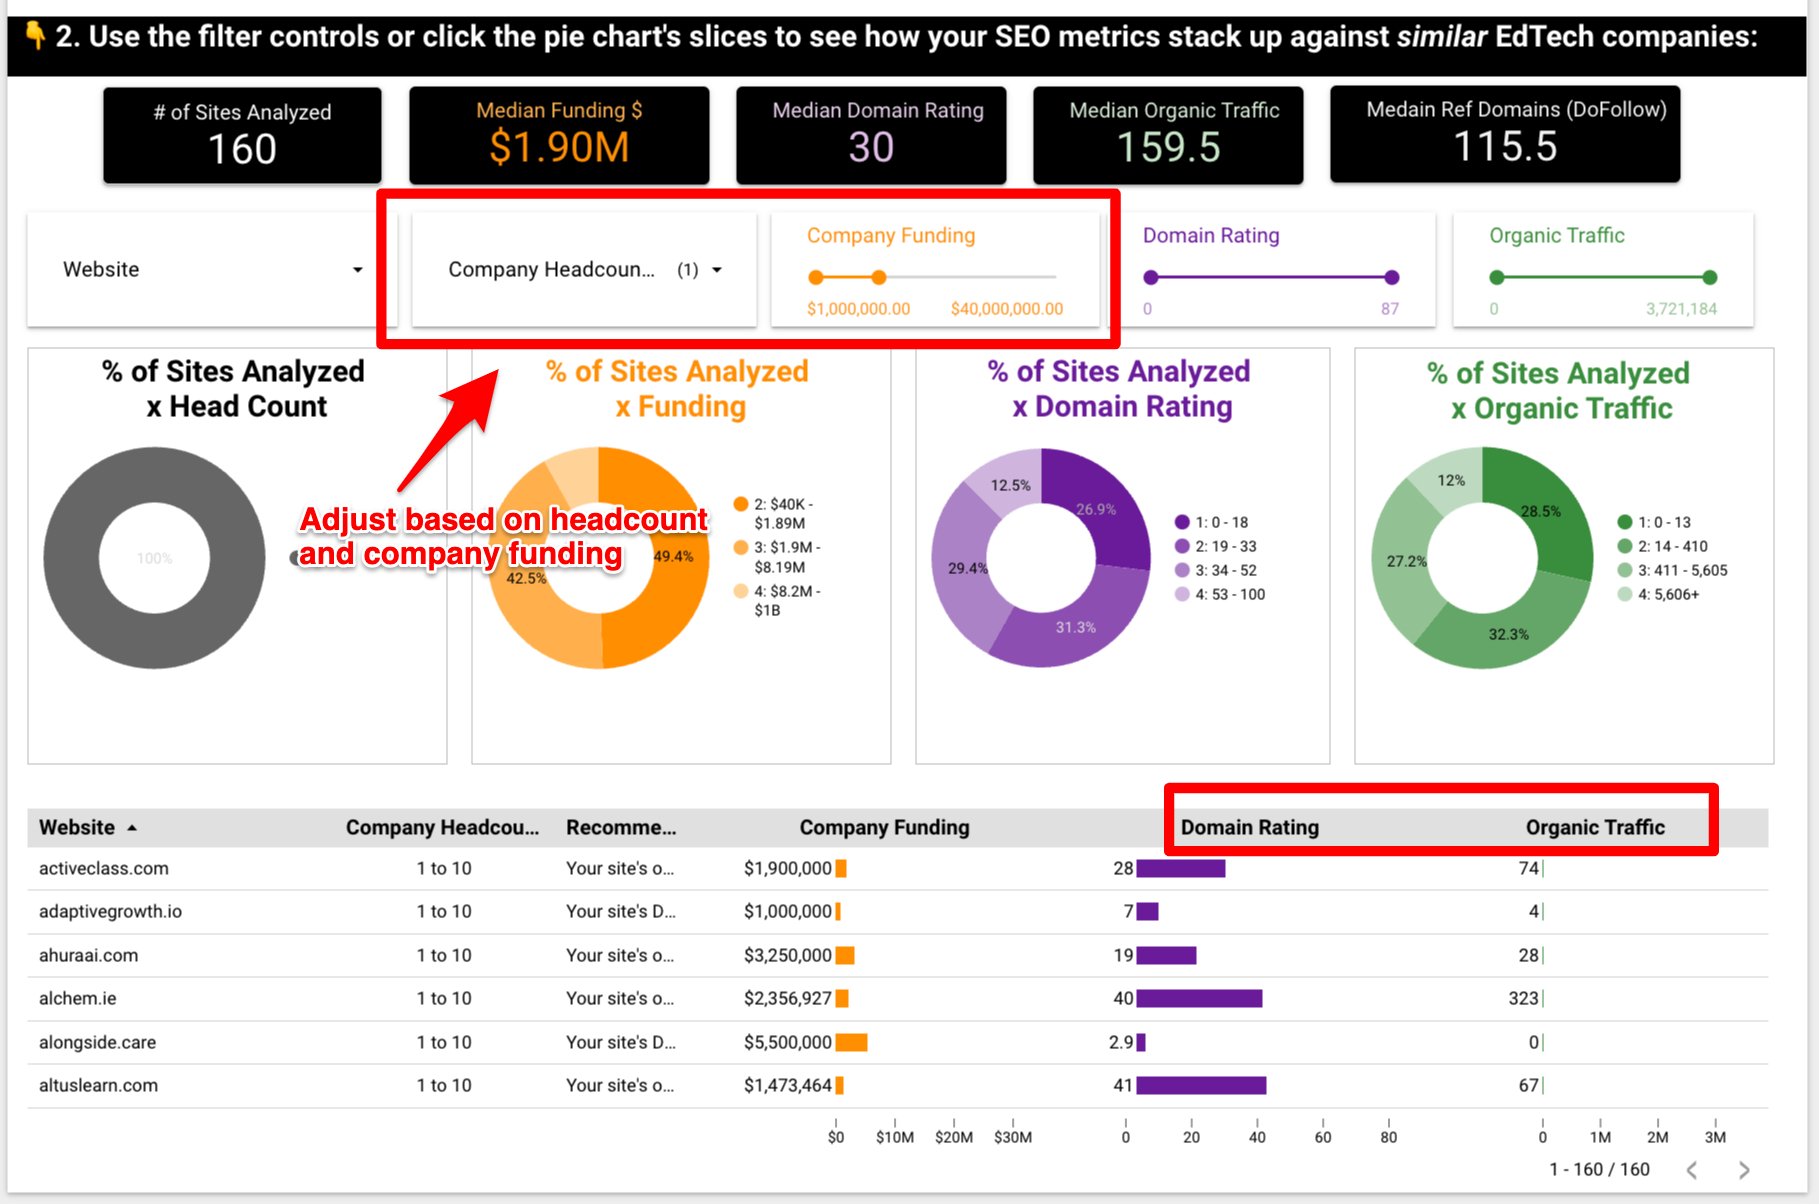
For example, let’s say you want to look only at companies that [a] have 1-10 in headcount and [b] 1-40 million in funding.
You can see the domain rating and organic traffic for those companies as well.
Special Offer - Free Organic Traffic Projection
My team built a separate tool called the Organic Traffic ROI Forecast.
It’ll show you what your organic traffic will look like in 12 months time. For four different scenarios…
Business as usual: i.e. doing nothing differently.
Basic SEO campaign: Optimizing pages for keywords you're already ranking for.
Aggressive content creation campaign: What’ll happen when you start publishing “lead optimized” content
Combination campaign: This is a combo of scenario’s 2 and 3.
This is a free report. We just have to collect a few data inputs from you.
So if you’re interested email justin@journeyengine.com. Make the subject line “I want a free traffic projection”.
We look forward to hearing from you!


